Candlestick patterns are powerful tools that visually represent market sentiment and potential price movements. These patterns offer traders critical insights into buyer and seller behavior, helping to anticipate future market trends. By understanding and leveraging candlestick patterns, traders can make informed decisions and enhance their profitability. This guide explores how to use candlestick patterns to identify and capitalize on market trends effectively.
Decoding the Language of Candlestick Patterns
Candlestick patterns are like a language of their own, conveying crucial information about market dynamics. Each pattern tells a story about the ongoing battle between buyers and sellers, revealing potential turning points in market trends. By learning to decode these patterns, traders can gain a deeper understanding of market sentiment and make more informed trading decisions. This section will explore some of the most significant candlestick patterns, breaking down their meanings and implications to help you navigate the market with confidence.
Key Candlestick Patterns and Their Directional Indicators
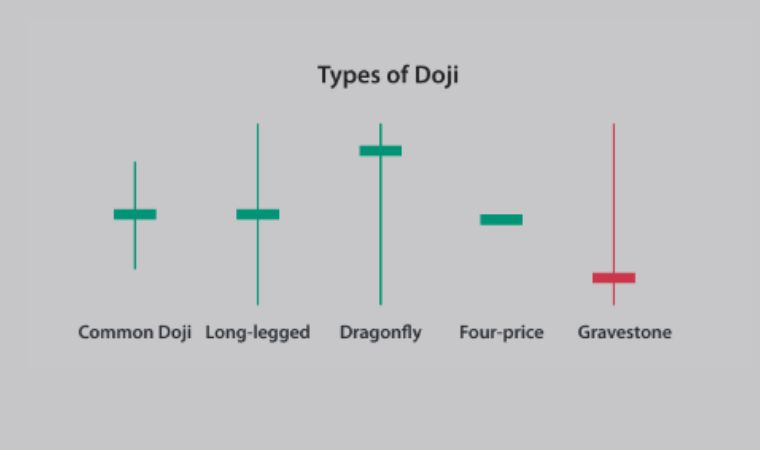
- Doji
A Doji candlestick has little to no body, indicating that the open and close prices are very close or identical. This pattern suggests indecision in the market, often appearing at the top or bottom of trends. While a Doji alone does not indicate direction, it signals that a change in the current trend may be imminent.
Direction: Reversal or continuation depending on the preceding trend and confirmation by subsequent candles.
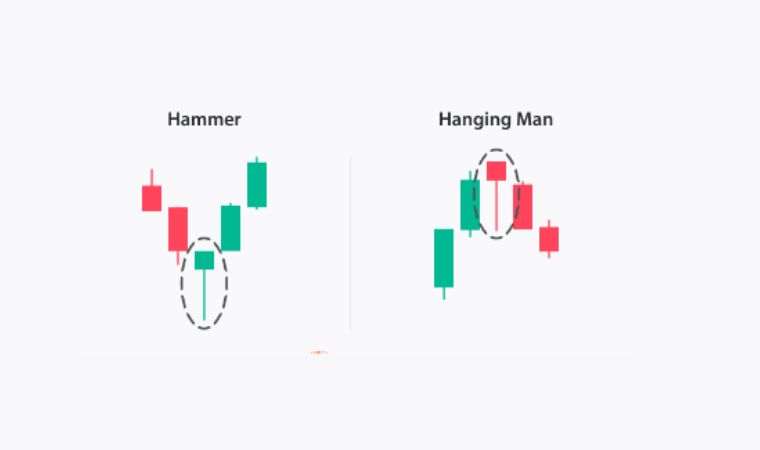
- Hammer and Hanging Man
The Hammer and Hanging Man are single-candle patterns with small bodies and long lower wicks. They typically appear at the end of downtrends and uptrends, respectively.
Hammer: Appears at the end of a downtrend, indicating a potential bullish reversal.
Hanging Man: Appears at the end of an uptrend, signaling a possible bearish reversal.
Direction: Hammer suggests an upward direction, while Hanging Man indicates a downward direction.
- Engulfing Patterns
Engulfing patterns consist of two candles. A bullish engulfing pattern occurs when a small bearish candle is followed by a larger bullish candle that completely engulfs it. Conversely, a bearish engulfing pattern occurs when a small bullish candle is followed by a larger bearish candle.
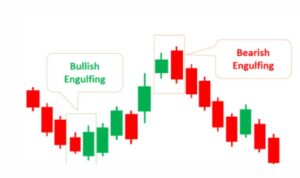
Bullish Engulfing: Appears at the end of a downtrend, indicating a potential upward reversal.
Bearish Engulfing: Appears at the end of an uptrend, indicating a possible downward reversal.
Direction: Bullish Engulfing signals an upward direction, while Bearish Engulfing signals a downward direction.
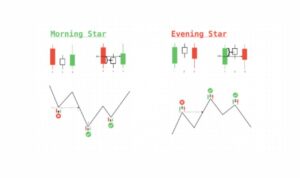
- Morning Star and Evening Star
These are three-candle patterns that often signal major market reversals.
Morning Star: Consists of a bearish candle, followed by a small-bodied candle (indicating indecision), and then a bullish candle. It appears at the bottom of a downtrend, suggesting a bullish reversal.
Evening Star: Consists of a bullish candle, followed by a small-bodied candle, and then a bearish candle. It appears at the top of an uptrend, indicating a bearish reversal.
Direction: Morning Star suggests an upward direction, while Evening Star indicates a downward direction.
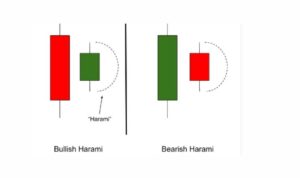
- Harami Patterns
Harami patterns consist of a large candle followed by a smaller candle that fits within the body of the previous candle. The bullish Harami appears at the end of a downtrend, while the bearish Harami appears at the end of an uptrend.
Bullish Harami: Indicates a potential upward reversal.
Bearish Harami: Suggests a potential downward reversal.
Direction: Bullish Harami signals an upward direction, while Bearish Harami signals a downward direction.
Integrating Candlestick Patterns into Algo Trading
For algorithmic traders, integrating candlestick patterns into trading strategies can enhance decision-making processes. Here’s how you can do it:
Pattern Recognition Algorithms : Develop algorithms that automatically recognize and categorize candlestick patterns. This involves programming the specific characteristics of each pattern into your trading software.
Backtesting: Test your pattern recognition algorithms against historical data to evaluate their effectiveness. This helps in understanding how well these patterns predict market directions.
Risk Management: Implement stop-loss and take-profit levels based on the identified patterns. This ensures you manage your risks while capitalizing on potential market moves.
Combine with Other Indicators: Enhance the reliability of candlestick patterns by combining them with other technical indicators like moving averages, RSI, or MACD. This multi-faceted approach increases the accuracy of your predictions.
Conclusion
Understanding the directional signals of candlestick patterns is a valuable skill for traders. Whether you are trading manually or using algorithmic strategies, recognizing patterns like Doji, Hammer, Engulfing, and Star formations can provide significant insights into market sentiment and potential price movements. By integrating these patterns into your trading strategy, you can make more informed decisions and improve your overall trading performance.