Introduction
Stock trading is an intricate art that blends analysis, strategy, and intuition. At its core, successful trading requires a deep understanding of market movements and the ability to predict future trends. Technical analysis is a vital tool in this endeavor, enabling traders to make informed decisions based on historical price data. Among the myriad of patterns and signals used in technical analysis, the concepts of Higher Highs and Lower Lows stand out as fundamental indicators of market direction.

Basics of Technical Analysis
Definition and Importance
Technical analysis involves evaluating securities by analyzing statistics generated by market activity, such as past prices and volume. Unlike fundamental analysis, which considers a company’s financial statements and economic factors, technical analysis focuses on stock price action and market sentiment.
Key Indicators Used in Technical Analysis
- Moving Averages (MA)
- Relative Strength Index (RSI)
- Moving Average Convergence Divergence (MACD)
- Bollinger Bands
Role of Price Patterns in Technical Analysis
Price patterns form the backbone of technical analysis. They represent the collective behavior of market participants and can indicate potential future movements. Recognizing these patterns helps traders anticipate market trends and make profitable trades.
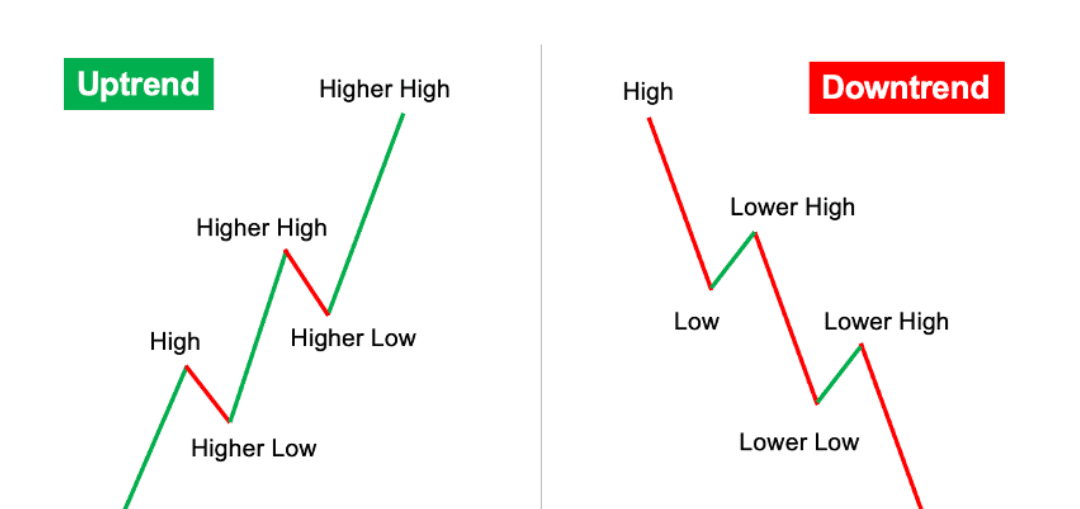
Understanding Higher Highs
Definition of Higher Highs
A Higher High occurs when the price of a security reaches a level higher than the previous peak. This pattern indicates an upward trend, suggesting that buyers are willing to pay increasingly higher prices.
Significance of Higher Highs in Stock Trading
Higher Highs signal strong bullish sentiment. They suggest that demand is outstripping supply, and the security’s price is likely to continue rising. This pattern is crucial for traders looking to capitalize on upward momentum.
How to Identify Higher Highs on a Price Chart
To identify Higher Highs:
- Look for peaks in the price chart.
- Compare the current peak to previous peaks.
- A Higher High is confirmed when the current peak is above the previous one.
Examples of Higher Highs in Different Market Conditions
In a bull market, Higher Highs are frequent as investor confidence drives prices up. Even in volatile markets, Higher Highs can occur, indicating potential entry points for traders.

Understanding Lower Lows
Definition of Lower Lows
A Lower Low happens when the price of a security falls below the previous trough. This pattern indicates a downward trend, reflecting increasing selling pressure.
Significance of Lower Lows in Stock Trading
Lower Lows signify bearish sentiment. They suggest that supply is outpacing demand, and the security’s price is likely to continue falling. Recognizing this pattern helps traders avoid losses or take short positions.
How to Identify Lower Lows on a Price Chart
To identify Lower Lows:
- Look for troughs in the price chart.
- Compare the current trough to previous troughs.
- A Lower Low is confirmed when the current trough is below the previous one.
Examples of Lower Lows in Different Market Conditions
In a bear market, Lower Lows are common as pessimism drives prices down. They can also appear in sideways markets, indicating potential exit points for traders.

Higher Highs and Lower Lows: Bullish and Bearish Trends
Definition of Bullish and Bearish Trends
- Bullish Trend: Characterized by rising prices and Higher Highs.
- Bearish Trend: Characterized by falling prices and Lower Lows.
Role of Higher Highs in Bullish Trends
Higher Highs confirm a bullish trend, indicating strong market confidence and sustained upward momentum.
Role of Lower Lows in Bearish Trends
Lower Lows confirm a bearish trend, signaling declining market confidence and continued downward pressure.
Case Studies and Examples
- Bullish Case Study: Analyzing a stock that consistently forms Higher Highs during an economic boom.
- Bearish Case Study: Examining a stock that repeatedly hits Lower Lows during a market downturn.
Combining Higher Highs and Lower Lows with Other Indicators
Moving Averages
Combining Higher Highs with a rising moving average strengthens the bullish signal, while Lower Lows with a falling moving average confirm a bearish trend.
Relative Strength Index (RSI)
An RSI above 70, coupled with Higher Highs, suggests an overbought market poised for a correction. Conversely, an RSI below 30, along with Lower Lows, indicates an oversold market ready for a rebound.
MACD (Moving Average Convergence Divergence)
MACD crossovers and divergences, combined with Higher Highs or Lower Lows, provide robust trading signals.
Volume Analysis
Higher volume accompanying Higher Highs indicates strong bullish sentiment, while increasing volume with Lower Lows confirms bearish momentum.
Examples
- Combining Higher Highs with a bullish MACD crossover for a strong buy signal.
- Using Lower Lows and an RSI below 30 to identify potential buying opportunities in a bear market.
Practical Applications
How to Use Higher Highs and Lower Lows in Day Trading
Day traders can leverage these patterns to identify intraday trends and capitalize on short-term price movements.
How to Use Higher Highs and Lower Lows in Swing Trading
Swing traders can use these patterns to enter trades at optimal points and ride the trend for several days or weeks.
Strategies for Entering and Exiting Trades Based on These Patterns
- Entry Strategy:Enter a long position on confirmation of a Higher High in an uptrend.
- Exit Strategy:Close a position if a Lower Low appears, signaling a potential trend reversal.
Common Mistakes and How to Avoid Them
Misidentifying Patterns
Avoid relying solely on a single indicator. Use multiple confirmations to validate patterns.
Over-Reliance on a Single Indicator
Combine Higher Highs and Lower Lows with other indicators to reduce false signals.
Ignoring Broader Market Conditions
Always consider the overall market environment when making trading decisions.
Tips for Avoiding These Mistakes
- Use a combination of indicators.
- Stay updated on market news and economic conditions.
- Practice pattern recognition through backtesting and paper trading.
Tools and Resources for Tracking Higher Highs and Lower Lows
Recommended Charting Software and Platforms
Educational Resources and Courses
- Books like “Technical Analysis of the Financial Markets” by John Murphy
- Online courses on platforms like Coursera and Udemy
Communities and Forums for Traders
- Reddit’s r/StockMarket
- Trade2Win
- Elite Trader
Conclusion
Understanding higher highs and lower lows is crucial for informed trading decisions. These patterns offer insights into market trends, aiding traders in anticipating price movements. By combining these concepts with other indicators, traders can enhance their strategies. In algorithmic trading, programmatically recognizing these patterns allows for automated strategies, leading to more efficient and profitable outcomes.
Additional Resources
Books and Articles on Technical Analysis
- Technical Analysis of the Financial Markets” by John Murphy
- A Beginner’s Guide to Charting Financial Markets” by Michael N. Kahn